Selling automatically because Delta is negative or a cell is highlighted.
04 / Footprint & Delta
Read Footprint without confusing volume with direction
A candle shows open, high, low and close. Footprint adds volume classified at Bid and Ask at each price. It describes execution, not participant identity or certain intentions.
What you need to understand
Who takes liquidity?
Trades initiated at Bid are generally classified as aggressive selling, and trades initiated at Ask as aggressive buying. Every trade still has both a buyer and a seller. Aggressive describes the liquidity taker.
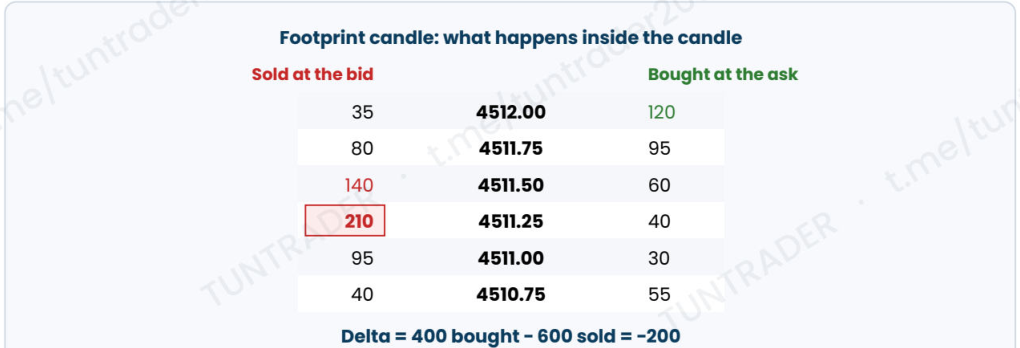
Calculate the diagram’s Delta
The book’s Bid column totals 600 contracts; Ask totals 400. Delta = 400 − 600 = −200. This measures an imbalance of initiative in the sample, not a guaranteed candle colour or next direction.
Connect numbers to price response
Positive Delta with rising price shows a consistent response. Positive Delta without progress invites investigation of possible passive resistance. Location, context and the next response matter, as do data quality and classification.
Worked example
The diagram shows 210 contracts sold at Bid at 4,511.25 versus 40 bought at Ask at the same price: 250 total traded there. Do not confuse this horizontal comparison with a diagonal imbalance calculation, which compares neighbouring prices according to platform settings.
Define the level to observe before examining Footprint, then check whether initiative actually moves price.
Simulation exercise
Sum both diagram columns to recover −200. Then find two negative-Delta candles in replay with different price responses and explain the role of context.
Source: TUNTRADER book — Wajdi Mansour, PDF file pages: 56, 57, 58, 66.
Content summarized and adapted for the site, with calculations made explicit. Examples are not current recommendations.
Open the passage in the book ↗